

GHG Emissions
KYF voluntarily conducts greenhouse gas (GHG) inventories to effectively manage emissions at each plant, following ISO 14064 –1: 2018 standards. The inventory covers 100% of operational sites, including both direct and indirect emissions, with 2024 as the base year.
2024 Greenhouse Gas Emissions
| Scope | Emission source | Shulin Plant | Yingge Plant | Yingge Plant 2 | Dongshan Plant | Total (All Plants) |
|---|---|---|---|---|---|---|
| Scope 1 | Category 1 Direct Emissions | 129.5780 | 404.3977 | 150.0602 | 304.6751 | 988.7110 |
| Scope 2 | Category 2 Energy indirect emissions | 3,220.3546 | 15,605.4347 | 2,475.7020 | 23,282.3520 | 44,583.8433 |
| Scope 3 | Category 3 Transportation indirect emissions | 9.9726 | 967.9823 | 16.3099 | 984.2366 | 1,978.5014 |
| Category 4 Indirect emissions from use of products by organization | 3,566.9143 | 85,459.1656 | 1,132.0720 | 104,899.4996 | 195,057.6515 | |
| Total | 6,926.820 | 102,436.980 | 3,774.144 | 129,470.763 | 242,608.707 | |
Description:
- Categories 5 and 6: No significant indirect GHG emissions.
- The GHG inventories for Yingge Plant, Yingge Plant 2, Shulin Plant, and Dongshan Plant have successfully passed third–party verification.
- Category 3 (employee commuting) was newly included in the 2024 GHG inventory.
- All calculation results have been converted into tCO2e (carbon dioxide equivalent) based on Global Warming Potentials (GWP – an authoritative emission coefficient) of relevant substances as
listed in the 6th IPCC report. - Of the seven major greenhouse gases in 2024, KYF’s emission sources include CO2, CH4, N2O, HFCs, and SF6.
- 2024 GHG Emission Intensity by Scope:
| Scope | Emission Intensity (tCO2e) | Note |
|---|---|---|
| Scope 1, Scope 2 | 0.7714 | = 45,572.5543 ÷ 59,074.2540 |
| Scope 3 | 3.3354 | = 197,036.1529 ÷ 59,074.2540 |
Note: Carbon emissions intensity per product = Total GHG emissions from all plants ÷ Total production volume of finished products by material type.
2024 GHG Reduction from Action Plans:
| Action Plan Items | Contents | Reduction | Carbon Emission Reduction (tCO2e) |
||||||||||||||||||||||
|---|---|---|---|---|---|---|---|---|---|---|---|---|---|---|---|---|---|---|---|---|---|---|---|---|---|
| Energy Conservation Initiative |
Benefits across all plants Reduced Emissions: 2,816,285.07kWh * 0.474kg CO2e/kWh (Electricity Carbon Emission Factor) ÷ 1,000 = 1,334.92 tCO2e
Note: Electricity emission factor used: 0.474 kg CO2e / kWh, published by the Energy Administration, |
2,816,285.07kWh | 1,334.92 | ||||||||||||||||||||||
| Waste Reduction Initiative |
Benefits across all plants Reduction: 30.9 waste tons Reduction in waste and corresponding carbon emissions based on each proposal project
|
30.9 tons | 11.12 | ||||||||||||||||||||||
| Recycled Material Replacing New Material Use |
Using recycled rPET resin or flakes to substitute virgin PET raw materials, thereby reducing carbon emissions from the raw material input phase.
Based on SimaPro (2023) data, the emission factors per kilogram are as follows: virgin PET – 3.183 kg CO2e ; rPET resin – 1.380 kg CO2e; and rPET flakes – 0.067 kg CO2e . Thisclearly demonstrates that recycled materials generate significantly lower carbon emissions compared to virgin materials. 2024 Recycled Material Usage and Projected Carbon Emission Reduction:
Note 1. Post–Consumer Recycled (PCR): materials discarded after consumer use, which are collected, cleaned, and reprocessed for reuse in manufacturing. – PCR plastic resins: small plastic pellets made from post–consumer recycled plastic that has been sorted, washed, shredded, melted, filtered, and pelletized. |
11,240 tons | 26,024.54 | ||||||||||||||||||||||
| Reuse of Regrind Materials |
Edge trim from production lines is collected, processed into regrind material, and reintroduced into production to reduce the use of new materials and achieve carbon reduction benefits. Carbon reduction benefits = the sum of (the total input of regrind material for each material category × the carbon emission factor for that material category).
|
46,923.1tons | 142,626.77 | ||||||||||||||||||||||
| Total | 169,997.35 | ||||||||||||||||||||||||
References
Statement of Verification
Issuing Organization: Taiwan Testing and Certification Center
Certificate Title: ISO 14064–1:2018


Factory: Yingge Factory,Yingge Factory 2,Shulin Plant,Dongshan Plant
Number : 113-GHG-003
Date :2025/05/29
Statement of Verification
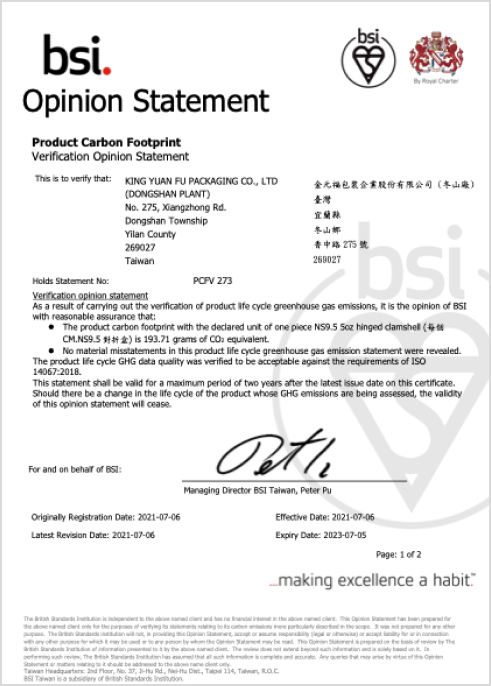
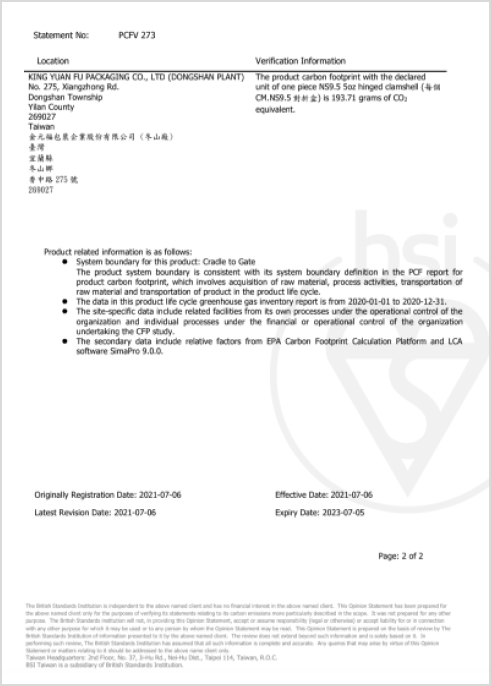
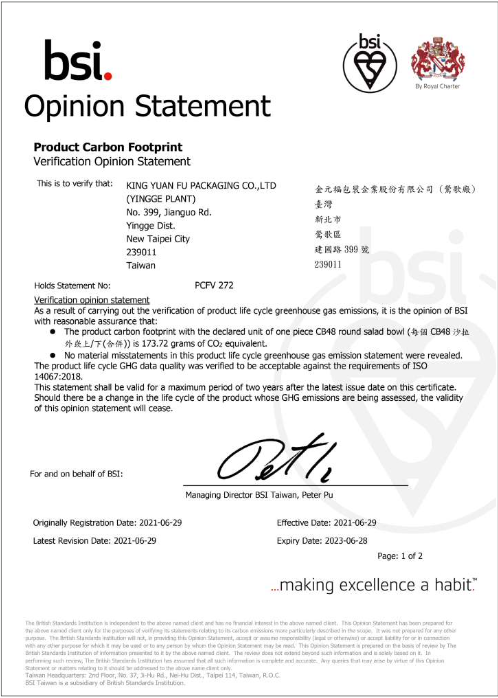
Issuing Organization: BSI OPINION STATEMENT
Certificate Title: ISO 14067 : 2018
Product: CM.NS9.5 hinged clamshell
Number :PCFV273
Date :2021/07/06
Product: CB48 round salad bowl
Number :PCFV272
Date : 2021/06/29

KING YUAN FU PACKAGING CO.,LTD
![]()