Energy Management
Energy management symbolizes a core task of our environmental policy and one of the two pillars of our decarbonization pathway strategy.
Energy Management
Energy management symbolizes a core task of our environmental policy and one of the two pillars of our decarbonization pathway strategy.
Energy Management
Energy management is a core focus of the Company’s environmental policy and one of the two key pillars of its decarbonization pathway.
TheCompany invests in energy conservation equipment and actively explores renewable electricity procurement options to fulfill its RE100 commitment,reduce carbon emissions, and create a positive environmental impact.
Policy and Commitment
Establish a carbon neutrality roadmap, continuously track progress, reduce electricity intensity, and increase the share of renewable electricity.
Official procurement of renewable electricity in 2024
Transferred renewable electricity
Short–term goal
Power consumption per ton of product to be ≤ 1,536.8 kWh by 202 5.
Energy–saving improvement proposals to achieve at least a 1.5% reduction in 2025.
Medium– and long–term goals
Renewable Electricity
Achieving RE100 commitment, 60% renewable energy in 2030, 90% renewable energy in 2040, 100% renewable energy in 2050.
Course of action
- Maintain the effectiveness of the ISO 50001 Energy Management System.
- Continuously advance internal energy-saving improvement initiatives in alignment with ESG goals.
Results
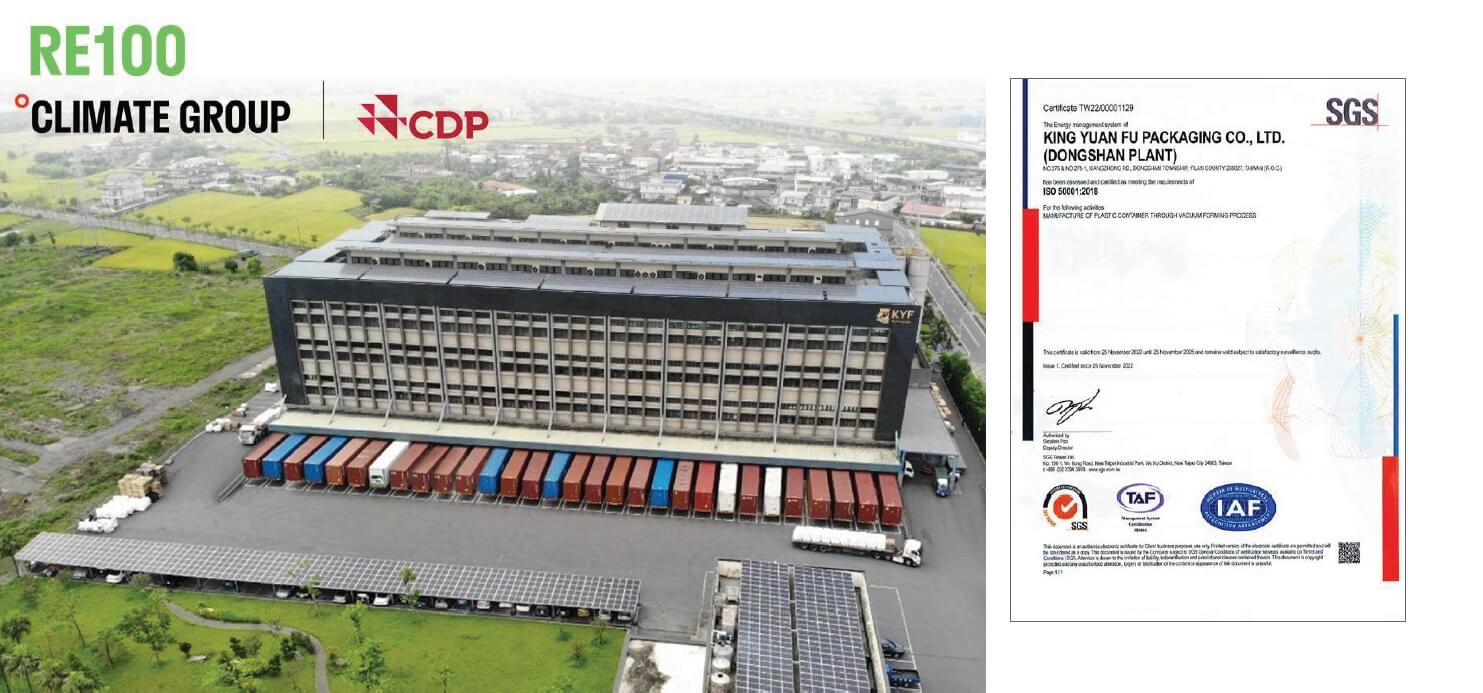
- In 2024, the Dongshan Plant maintained the effectiveness of the ISO 50001 Energy Management System.
- Internal energy–saving improvements led to a total electricity saving of 2,401,441 kWh.
- Energy–saving improvement proposals successfully achieved the 1% electricity savings target.
Responsible unit
Sustainable Development Department
Energy Consumption
Due to our process requirements, our main energy source is purchased electricity. Power conservation therefore represents our core strategy to maximize our positive influence in the environmental dimension. The scope of our energy consumption reporting in 2024 encompassed the Shulin, Yingge, and Dongshan plants, as well as the Yingge Plant 2 achieving a coverage rate of 100%.
Energy consumption conditions in 2024
| Energy categories | Type | Shulin Plant | Yingge Plant | Dongshan Plant | Yingge Plant 2 | Total | MJ Coefficient | Total energy consumption (MJ) |
|---|---|---|---|---|---|---|---|---|
| Purchased electricity – conventional sources (kWh) |
Non– renewable |
6,793,997.00 | 32,922,858.00 | 49,118,886.00 | 5,223,000 | 94,058,741.00 | 1kWh = 3.6*(10^-6)TJ | 338.611468 |
| Purchased electricity – solar (kWh) |
Renewable | 0 | 1,561,325 | 6,048,056 | 100,000 | 7,709,381.00 | 1kWh = 3.6*(10^–6)TJ | 27.7537716 |
| Diesel (liter) | Non– renewable |
19,588.26 | 24 | 352 | 38.95 | 20,003.21 | 1千卡=4.187*(10^-9)TJ | 0.0000838 |
| LPG (liter) | Non– renewable |
0 | 58.18 | 563.58 | 0 | 621.76 | 1千卡=4.187*(10^-9)TJ | 0.0000026 |
| Gasoline (liter) | Non– renewable |
0 | 4608.5 | 0 | 1614.18 | 6,222.68 | 1千卡=4.187*(10^-9)TJ | 0.0000261 |
| Self–consumed on–site solar energy (kWh) |
Renewable | 0 | 10,866.4 | 134,889.7 | 106,146.4 | 251,902.5 | 1kWh = 3.6*(10^-6)TJ | 0.906849 |
| Total | 367.2722011 | |||||||
Note:
- Conversion factors source: Unit conversion table from the Energy Administration, Ministry of Economic Affairs (Taiwan).
- Renewable electricity certificates (direct supply): Records of direct supply certificate transactions can be found at by searching “金元福包裝”.
- The plant is equipped with on–site solar facilities: Self–consumption renewable electricity certificates (search “金元福包裝” at). Certificate records for 2024 are as follows:
– Yingge Plant Solar Power Generation Certificate number: 21SP0031–B024000001~11
– Yingge Plant 2 Solar Power Generation Certificate number: 24SP0850–B024000001~8 (On–site solar renewable electricity generation began
in October 2023; certificates were issued in November 2024 after application processing.)
– Dongshan Plant Solar Power Generation Certificate number: Certificates were applied for in January 2025; therefore, no renewable electricity
certificate data is available for 2024.
Solar Power Generation by Plant:
Electricity Unit (kWh)
| Category | Plant | Feed–in Meter No. / Meter No. | Installed Capacity (kW) | 2022 | 2023 | 2024 |
|---|---|---|---|---|---|---|
| Feed–in Tariff to Taipower | Dongshan | 03–44–6362–99–4 | 498.928 | 407,440 | 472,672 | 238,208 |
| Feed–in Tariff to Taipower | Dongshan | 03–44–6362–98–3 | 288.05 | 263,172 | 285,900 | 176,316 |
| Feed–in Tariff to Taipower | Dongshan | 03–44–6361–99–3 | 187.68 | 171,968 | 181,940 | 113,572 |
| Self–Consumption | Dongshan | 03–44–6362–01–7 | 498.928 | – | – | 46,944 |
| Self–Consumption | Dongshan | 03–44–6362–01–7 | 288.05 | – | – | 37,116 |
| Self–Consumption | Dongshan | 03–44–6362–01–7 | 187.68 | – | – | 50,830 |
| Self–Consumption | Yingge | 05–81–5596–11–7 | 10.065 | 10,995.7 | 11,645 | 10,866.4 |
| Self–Consumption | Yingge Plant 2 | 05–81–5599–11–0 | 104.14 | – | 17,821 | 106,146.4 |
Total Plant Electricity Consumption (2022–2024):
| Plant | 2022 | 2023 | 2024 | Difference 2024 vs 2023 (%) |
|---|---|---|---|---|
| Shulin Plant | 10,050,658 | 6,596,126 | 6,793,997.00 | 2.91% |
| Yingge Plant | 36,675,488 | 34,591,152 | 34,495,049.40 | –0.28% |
| Dongshan Plant | 49,855,056 | 49,291,921 | 55,301,831.70 | 10.87% |
| Yingge Plant 2 | – | 1,775,600 *Building in use since October 2023 |
5,429,146.40 | 67.3% |
| Total Power Consumption | 96,581,202 | 92,254,799 | 102,020,025 | 9.57% |
As shown in the table above, total electricity consumption increased by 9.57% in 2024 compared to 2023, primarily due to expanded production capacity. However, electricity consumption per metric ton of output showed a declining trend, as illustrated in the following table ”Electricity Consumption per Metric Ton of Finished Product.” Internal energy–saving initiatives continue to be implemented.
Electricity Consumption per Metric Ton of Finished Product (2022–2024):
| 2022 | 2023 | 2024 | |
|---|---|---|---|
| Average Electricity per Metric Ton of Finished Product (kWh) |
1,684.0 |
1,592.9 |
1,493.3 |
Note: Based on ESG Committee discussions, total shipment volume was deemed an inaccurate basis for assessing electricity consumption related to finished product manufacturing. Therefore, starting in 2022, the analysis has been based on the production volume of finished products.
Formula = [Power consumption of all plants – (Office power consumption + Dormitory power consumption)] ÷ [Total shipment volume of finished goods in all material categories × Sum of all material density parameters converted into PET density]
Energy Consumption per Metric Ton of Finished Product (2022–2024):
| 2022 | 2023 | 2024 | |
|---|---|---|---|
| Total Annual (MJ) |
347,881,990.45 |
332,223,469.8 |
367,039,622.61 |
| Total weight in tons based on converted density for each material |
57,463.56 |
56,800.49 |
64,531.18 |
| Average energy consumption per ton output of finished goods (MJ) (Energy Intensity) |
6,053.96 |
5,848.95 |
5,687.79 |
Note: 1 kWh = 3.6 MJ; 1 kcal=4.187*(10^–3) MJ
Power Conservation and Energy Management
All KYF production sites comply with Article 12 of the Energy Management Act, reporting annual energy use to the Bureau of Energy, MOEA. Reviewing the past three years of energy–saving performance, the average annual power–saving rate at each plant exceeded the regulatory requirement of 1% every year.
| Year | Shulin Plant | Yingge Plant | Dongshan Plant | Yingge Plant 2 |
|---|---|---|---|---|
| 2022 | Power saving rate for the respective year: 0.11%
Average annual power saving rate: 1.95% |
Power saving rate for the respective year: 0.45%
Average annual power saving rate: 1.45% |
Power saving rate for the respective year: 1.7%
Average annual power saving rate:1.88% |
– |
| 2023 | Power saving rate for the respective year: 0.93%
Average annual power saving rate: 1.9% |
Power saving rate for the respective year: 0.32%Average annual power saving rate: 1.34% |
Power saving rate for the respective year: 0.8%
Average annual power saving rate:1.73% |
Complete preliminary declaration |
| 2024 | Power saving rate for the respective year: 2%
Average annual power saving rate: 1.9% |
Power saving rate for the respective year: 1.5%
Average annual power saving rate: 1.35% |
Power saving rate for the respective year: 2.64%
Average annual power saving rate:1.84% |
Power saving rate for the respective year: 1.21%
Average annual power saving rate: 1.21% |
Note: According to the amendment to the Regulations for Setting and Implementing Energy Saving Targets and Action Plans for Energy Users issued by the Ministry of Economic Affairs (Taiwan) on December 25, 2019, energy users with a contracted capacity exceeding 800 kW are required to achieve an average annual power saving rate of at least 1.0% over the ten-year period from 2015 to 2024. For each year, the power saving rate under the annual energy–saving target and action plan must be greater than or equal to 1.0%. Power savings are calculated as the sum of savings achieved through all implemented energy–saving measures.
Completion and reporting of energy–saving improvement projects for the year 2024, including cases of electricity savings and energy efficiency measures.
| Plant | No. of Projects | Energy Saved (kWh) | Total Energy (TJ) |
|---|---|---|---|
| Shulin Plant | 3 | 118,233.67 | 0.4256 |
| Yingge Plant | 3 | 523,150.71 | 1.8833 |
| Dongshan Plant | 12 | 1,489,510.67 | 5.3622 |
| Yingge Plant 2 | 1 | 10,483.00 | 0.0377 |
| Total | 19 | 2,141,378.04 | 7.7088 |
In addition to energy–saving reports, internal energy–saving improvement projects are tracked for effectiveness in each quarterly ESG committee meeting. The total number of internal proposals and their performance in 2024 were as follows:
In addition to energy–saving reports, internal energy–saving improvement projects are tracked for effectiveness in each quarterly ESG committee meeting. The total number of internal proposals and their performance in 2024 were as follows:
| Plant | No. of Energy–saving Projects | Energy Saved (kWh) | Total Energy Saved (kWh) | Total Energy (TJ) |
|---|---|---|---|---|
| Yingge Plant | 2 | 556,140 | 2,401,441 | 8.65 |
| Shulin Plant | 1 | 63,948 | ||
| Dongshan Plant | 5 | 1,781,354 |
RE100 Membership
In August 2021, we became an official member of the Climate Group’s RE100 Initiative (media coverage link) and the first (and so far only) plastic container manufacturer to pass the RE100 review process. We commit to achieve 100% renewable electricity by 2050. We have set clearly defined goals of 60% and 90% renewable energy in 2030 and 2040, respectively , to ensure ongoing progress toward the net –zero vision and make a contribution to keeping the global tempe rature rise within 1.5°C.
In 2022, the Dongshan Plant participated in the Demonstration Guidance Project for Energy Management in the Manufacturing Sector organized by the Industrial Development Bureau (IDB) of the Ministry of Economic Affairs. The guidance consultant assisted the plant in gaining a deeper insight into energy management processes and fundamentals with the ultimate goal of giving employees a better understanding of energy management practices and accelerating the implementation process. The plant passed the certification audit for the ISO 500001 Ene rgy Management System in 2022 and continued to maintain its ef fectiveness in 2023.


